
Population
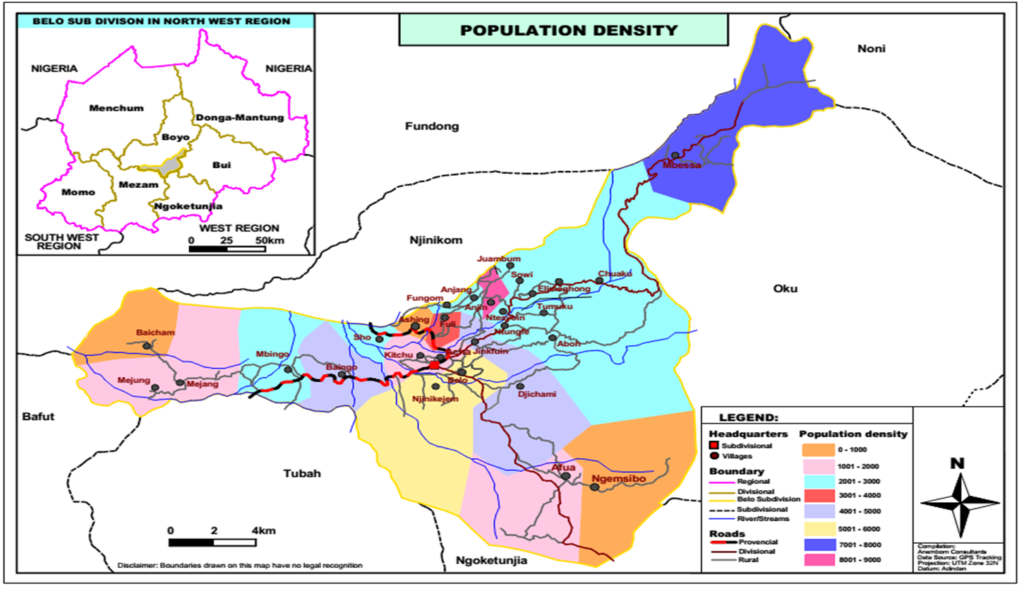
The estimated population of Belo stands at 88,664 inhabitants. The council area is made up of 5 ethnic groupings namely: Kom, Mbessa, Mejanng, Mejunng, Baicham and the Mbororos. On the general scale, the population distribution by village is per the table below
Table 5:Population distribution by village in the Belo Council Area
| s/n | Village | Estimated population | Village | Estimated population | Village | Estimated population | ||
| 1. | Aboh | 2,813 | 11. | Djichami | 4,501 | 21. | Mejung | 1,088 |
| 2. | Acha | 1,590 | 12. | Elimeghong | 2,813 | 23. | Njinikijem | 5,910 |
| 3. | Afua | 1,700 | 13. | Fuli | 3,686 | 24. | Nteh Ayoin | 2,813 |
| 4. | Ashing | 700 | 14. | Fungom | 2,813 | 25. | Ntungfe | 2,813 |
| 5. | Anjang | 2,813 | 15. | Jinkfuin | 4,150 | 26. | Sho | 2,666 |
| 6. | Anjin | 8,787 | 16. | Juambum | 2,813 | 27. | Sowi | 2813 |
| 7. | Baicham | 612 | 17. | Kitchu | 1,551 | 28. | Tumuku | 2,813 |
| 8. | Baingo | 4,977 | 18. | Mbessa | 7,251 | 29. | Twalatwal | 2,813 |
| 9. | Belo | 5,072 | 19. | Mbingo | 2,125 | |||
| 10. | Chuaku | 2,813 | 20. | Mejang | 1,355 | ESTIMATED TOTAL | 88,664 |
Source : Belo Council
Of this population, 32,425 – 36.6% live in the urban setting while 56,239- 63.4% live in the rural setting. The population by age groupings shows that, 0-59 months has an estimated population of 14,135 while 19,635 is made up of school going age (4-16 years). Young people are 29,035. The table below summarizes the population by age groups in Belo Council area.
Table 6: Population by age groups in Belo Council Area
| The whole population | Specific Group ([1]) | |||||||||
| No | Village/
Quarter |
Men | Women | Total | Babies
(0-35 months) (10,7%) |
EPI target Population
(0-59 months) (16,9%) |
Pre-school age Population
(4-5 years) (6,3%) |
Primary school age Population
(6-14 years) (23,4%) |
Adolescents
(12-19 years) (18,5%) |
Youthful Population
(15-34 years) (34,7%) |
| URBAN SPACE QUARTERS | ||||||||||
| 1. | Acha | 779 | 811 | 1590 | 170 | 268.7 | 100 | 372 | 294 | 551.7 |
| 2. | Ashing | 343 | 357 | 700 | 74.9 | 118 | 44 | 163.8 | 129.5 | 242.9 |
| 3. | Baingo | 2439 | 2538 | 4977 | 532.5 | 841 | 313.5 | 1164.6 | 920.7 | 1727 |
| 4. | Belo | 2485 | 2587 | 5072 | 542.7 | 857 | 319 | 1186.6 | 938 | 1759.9 |
| 5. | Fuli | 1805 | 1879 | 3684 | 394 | 622.5 | 2320.9 | 865.7 | 681.5 | 1278 |
| 6. | Jinkfuin | 2034 | 2117 | 4150 | 444 | 701 | 2614 | 971 | 767.7 | 1440 |
| 7. | Kitchu | 760 | 791 | 1551 | 165.9 | 262 | 977 | 362.9 | 286.9 | 538 |
| 8. | Mbingo | 1041 | 1084 | 2125 | 227 | 359 | 1338.7 | 499 | 393 | 737 |
| 9. | Njinikejem | 2896 | 3014 | 5910 | 632 | 998.7 | 3723 | 1388.8 | 1093 | 2050.7 |
| 10. | Sho | 1306 | 1360 | 2666 | 285 | 450.5 | 1679.5 | 626.5 | 493 | 925 |
| Urban space sub-total | 32425 | 3468 | 5478 | 5997 | 11250 | |||||
| VILLAGES | ||||||||||
| 11. | Aboh | 1378 | 1435 | 2813 | 300.9 | 475 | 1772 | 661 | 520 | 976 |
| 12. | Afua | 833 | 867 | 1700 | 181.9 | 287 | 1071 | 397.8 | 314.5 | 589.9 |
| 13. | Anjang | 1378 | 1435 | 2813 | 300.9 | 475 | 1772 | 661 | 520 | 976 |
| 14. | Anjing | 4306 | 4481 | 8787 | 940 | 1485 | 5535.8 | 2056 | 1625 | 3049 |
| 15. | Baicham | 300 | 312 | 612 | 65 | 103 | 448 | 143 | 113 | 212 |
| 16. | Chuaku | 1378 | 1435 | 2813 | 300.9 | 475 | 1772 | 661 | 520 | 976 |
| 17. | Djichami | 2205 | 2296 | 4501 | 481.6 | 760.6 | 2835.6 | 1053 | 832.6 | 1561.8 |
| 18. | Elimeghong | 1378 | 1435 | 2813 | 300.9 | 475 | 1772 | 661 | 520 | 976 |
| 19. | Fungom | 1378 | 1435 | 2813 | 300.9 | 475 | 1772 | 661 | 520 | 976 |
| 20. | Juambum | 1378 | 1435 | 2813 | 300.9 | 475 | 1772 | 661 | 520 | 976 |
| 21. | Mbessa | 3553 | 3698 | 7251 | 775.8 | 1225 | 4568 | 1703.9 | 1341 | 2516 |
| 22. | Mejang | 664 | 691 | 1355 | 144.9 | 228.9 | 853.6 | 318 | 250.6 | 470 |
| 23. | Mejung | 533 | 555 | 1088 | 116. | 183.8 | 685 | 255.6 | 201 | 377 |
| 24. | Ngemsibo | 343 | 358 | 701 | 75 | 118 | 441 | 164.7 | 129 | 243 |
| 25. | Nteh-Ayoin | 1378 | 1435 | 2813 | 300.9 | 475 | 1772 | 661 | 520 | 976 |
| 26. | Ntungfe | 1378 | 1435 | 2813 | 300.9 | 475 | 1772 | 661 | 520 | 976 |
| 27. | Sowi | 1378 | 1435 | 2813 | 300.9 | 475 | 1772 | 661 | 520 | 976 |
| 28. | Tumuku | 1378 | 1435 | 2813 | 300.9 | 475 | 1772 | 661 | 520 | 976 |
| 29. | Twalatwal | 1378 | 1435 | 2813 | 300.9 | 475 | 1772 | 661 | 520 | 976 |
| Rural space subtotal | 43788 | 45,575 | 56239 | 4302 | 9142 | 10843 | 19755 | |||
| Total Population of the Council | 88664 | 7770 | 14620 | 35190 | 20747 | 16840 | 31005 | |||
Projection: Anembom 2017
([1]) According to the General Population Census Results of 2005
